

In my Q4 update, I argued that Evolution had found a floor, although the recovery was still uncertain. In Q1, the picture was mixed again. The Americas were growing, Asia was showing some improvement, and Europe remained weak. Currency movements made the reported numbers look worse, while the cancelled dividend raised questions about what the board planned to do with the cash.
Q2 then showed some progress. Revenue increased 0.9% from Q1 to €517.8 million, although it was still down 1.2% from the previous year. Europe returned to sequential growth, but Asia took a step back. The EBITDA margin improved to 65.9%. The board also started the buyback programme, giving a clearer answer to the capital allocation question from Q1.
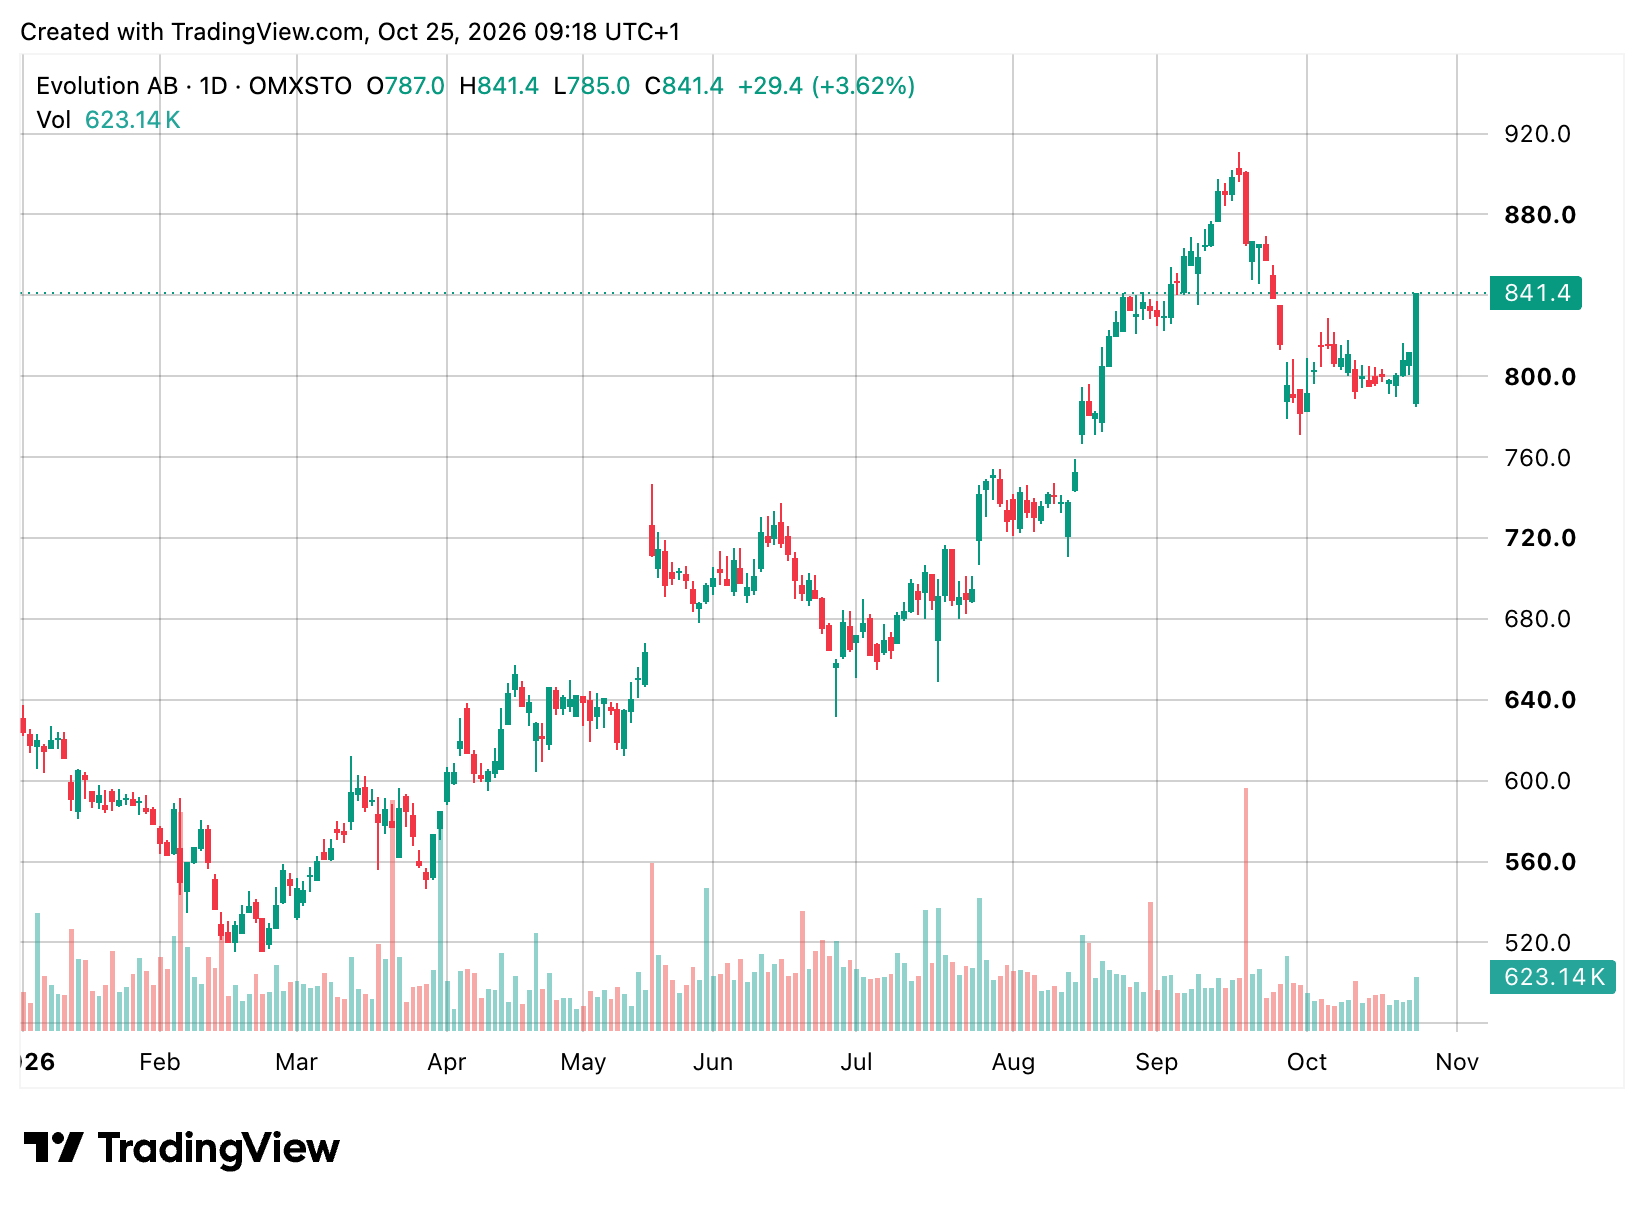
The Q3 report gives us some answers. Revenue is growing again, all regions improved compared with Q2, and more than a billion euros has gone into share buybacks. Several parts of the investment case are moving in the right direction.
But the recovery is taking time. Europe and Asia are still growing slowly, and part of the better reported growth comes from a much smaller currency headwind. The temporary closure of the Brazilian studio also puts pressure on a market I previously saw as an important source of growth.
I remain positive on the long-term case. Q3 gives me more confidence in the margins and capital allocation, but I still want to see stronger growth in the business itself.
That recovery raises the bar for the investment case. Further down, I revisit the valuation using the latest numbers and slower growth than in my earlier model.
Currency had much less impact this quarter
The weak dollar was an important part of the story in earlier quarters. In Q1, North American revenue grew 10.1% in euros, while growth in local currency was above 21%. Looking only at reported growth gave a rather weak picture of what was happening.
In Q3, this difference was much smaller. Group revenue grew 3.7% to €526.1 million, compared with an estimated 4.0% at constant currency.
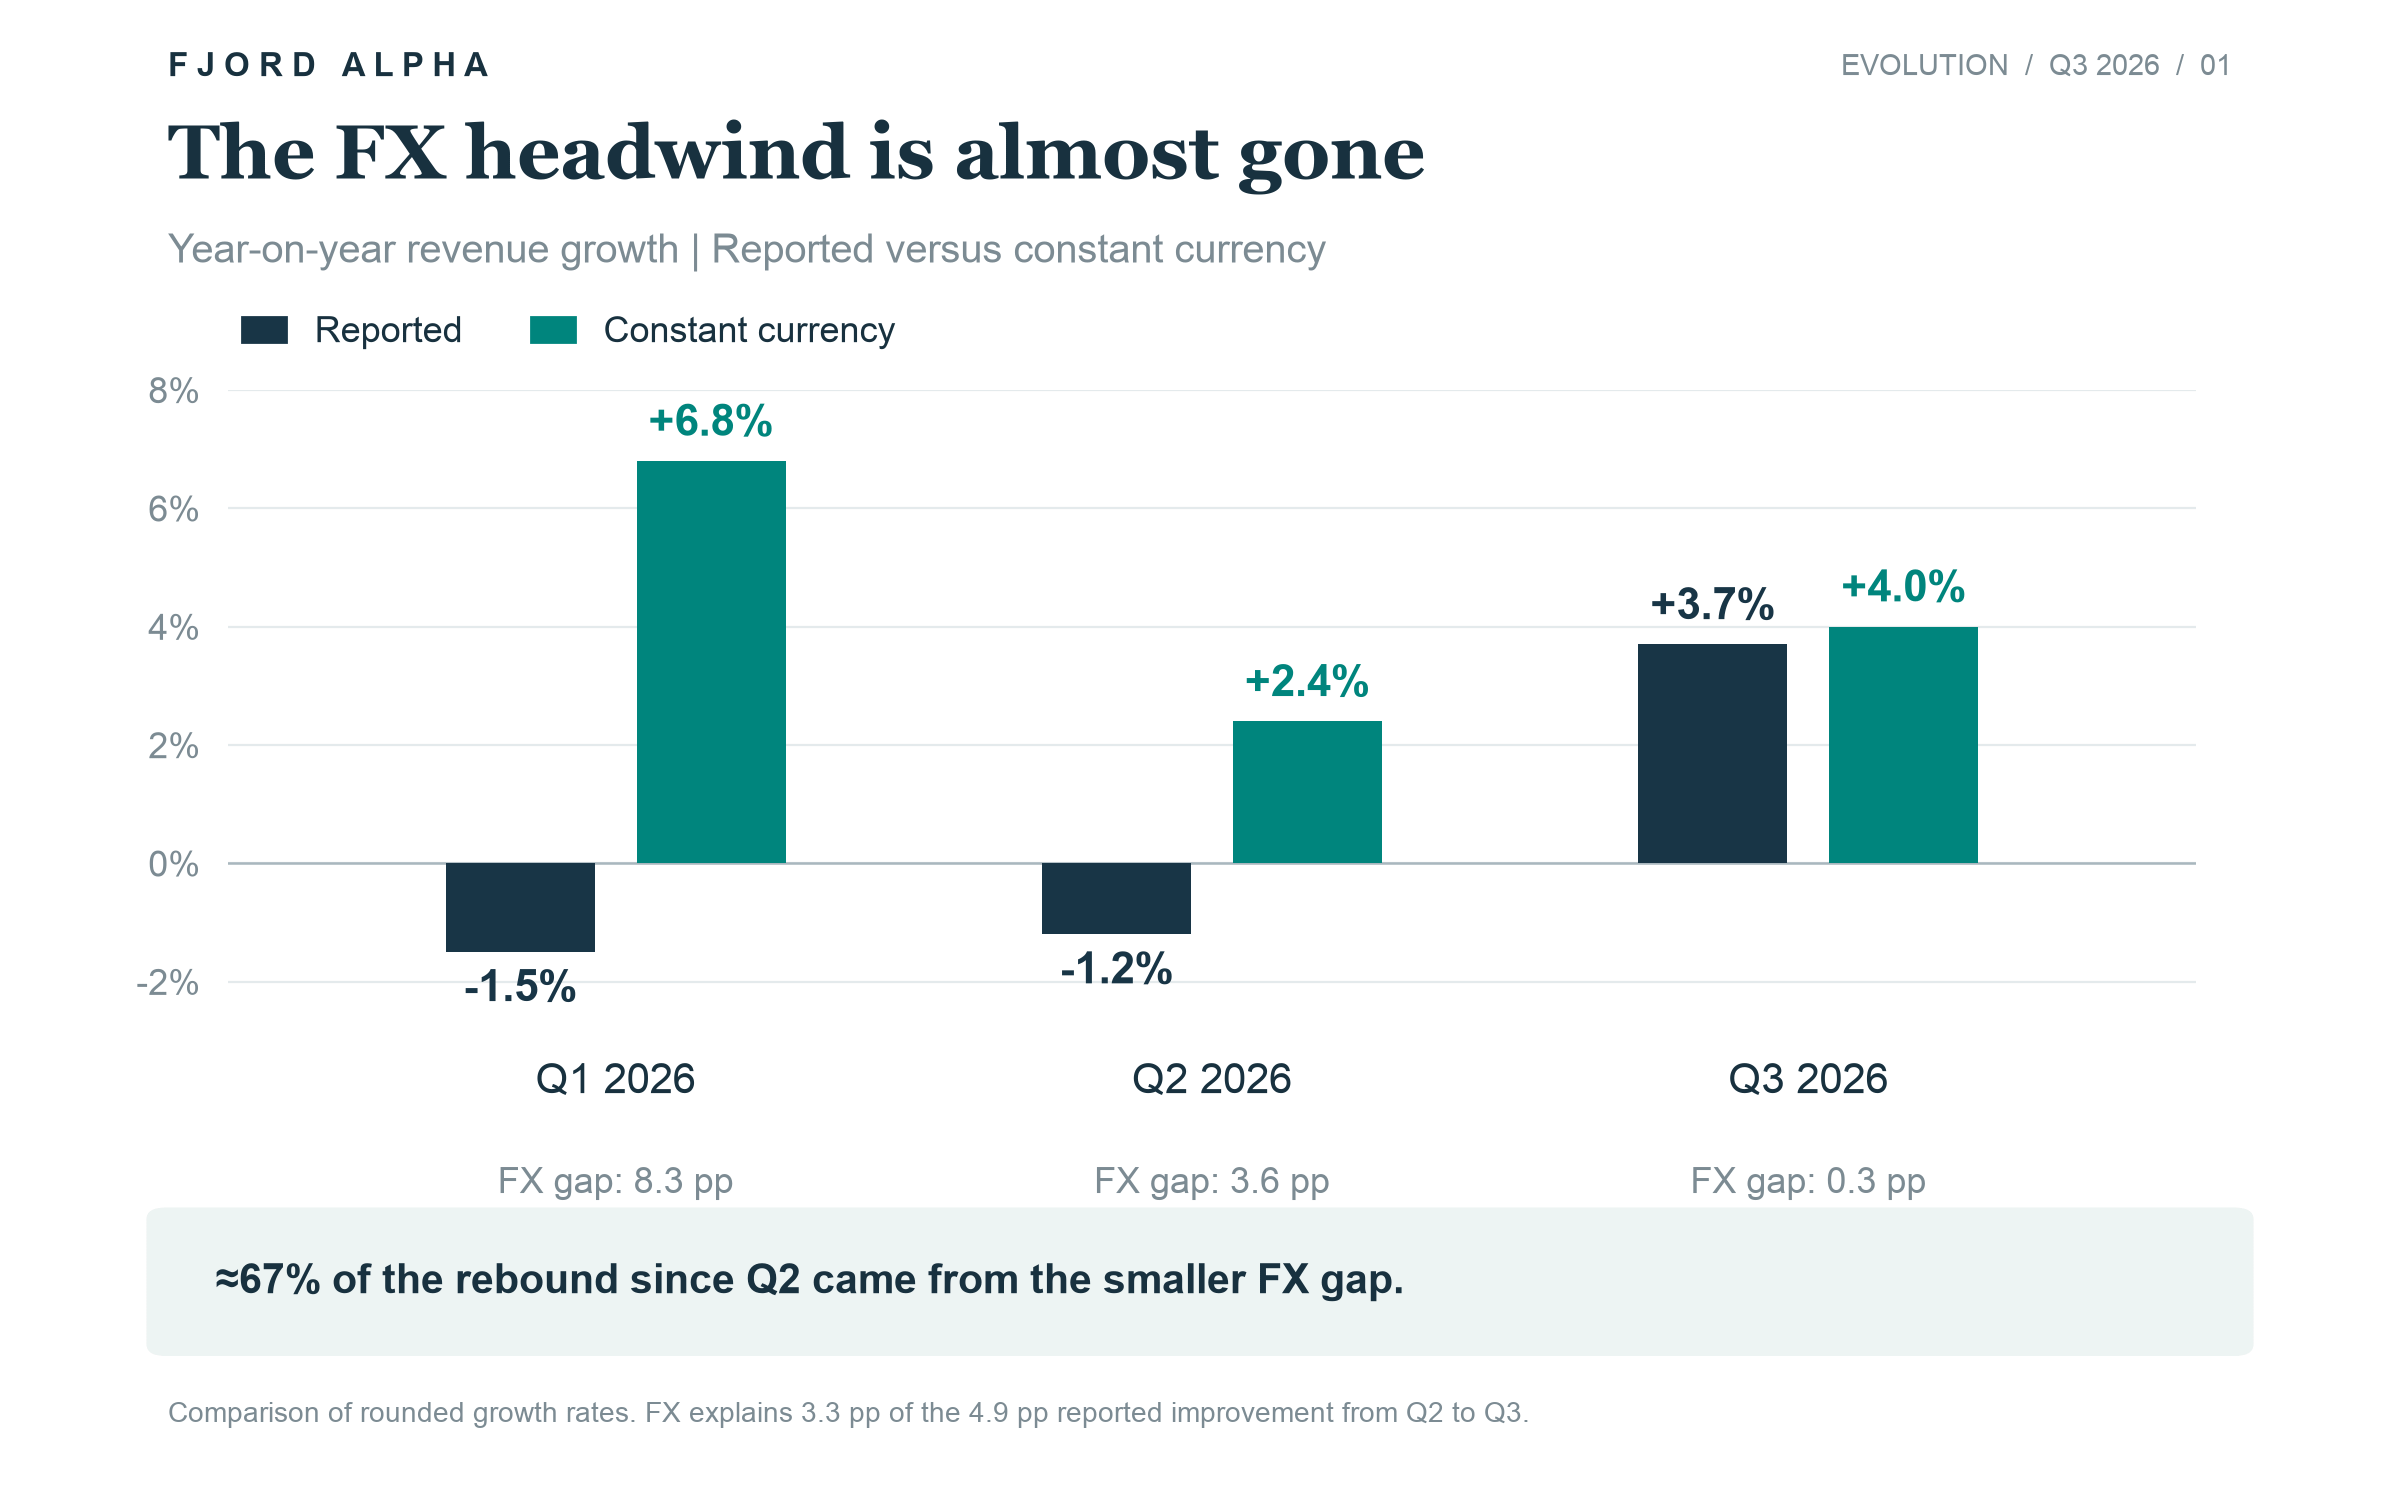
Reported growth increased by 4.9 percentage points from Q2 to Q3. About 3.3 points of this came from the smaller currency headwind. In other words, roughly two-thirds of the improvement in the reported growth rate came from less FX pressure.
There was also an improvement in the business. Growth at constant currency increased from 2.4% to 4.0%. But it is still below the 6.8% seen in Q1. Positive reported growth is welcome, but it does not mean Evolution has returned to its earlier growth rates.
Currency movements also increased operating expenses by €1.2 million in Q3. The revenue growth rates do not show the full effect on earnings.
The Americas and RNG continue to grow
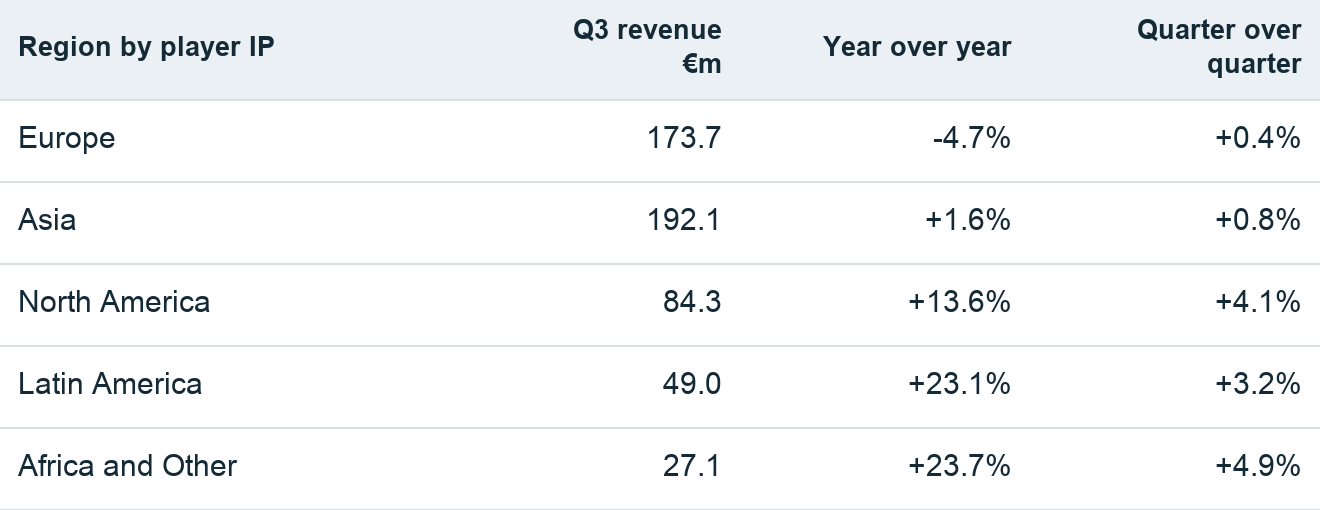
The regional shift I discussed in Q1 is continuing. North America grew 13.6% to €84.3 million, Latin America grew 23.1% to €49.0 million, and Africa and Other grew 23.7% to €27.1 million.
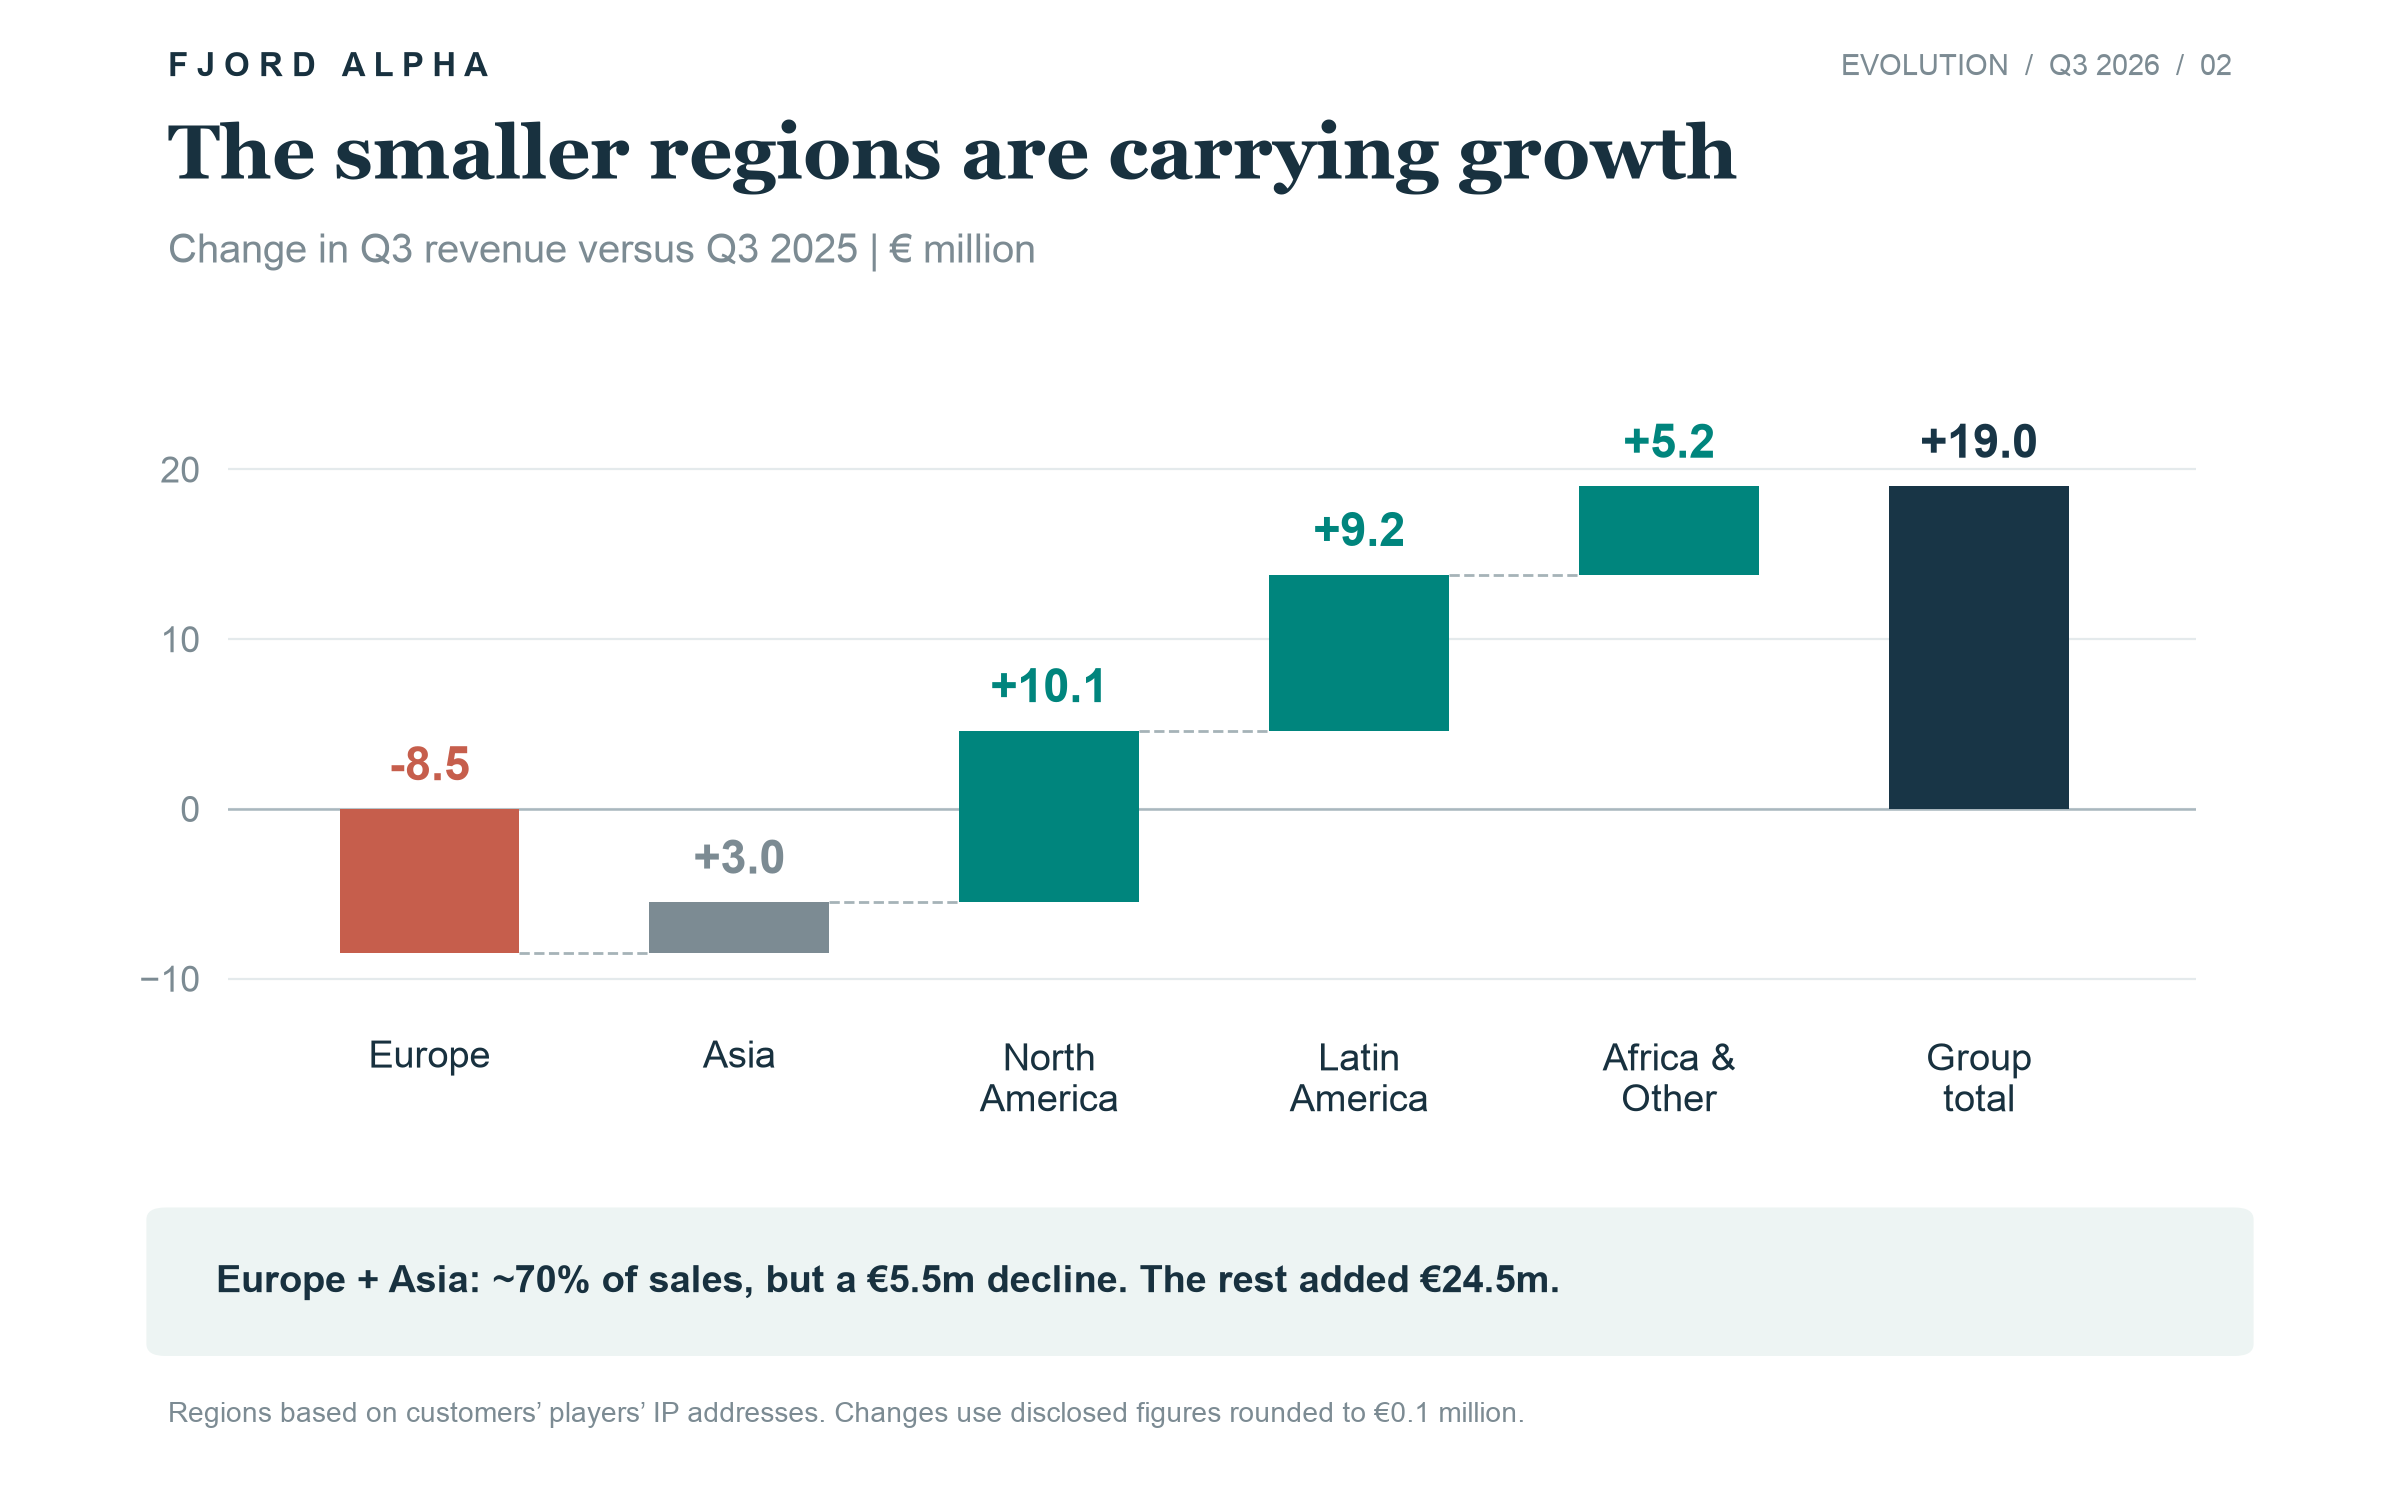
Together, these regions added around €24.5 million of revenue compared with last year. Europe’s decline reduced that benefit by €8.5 million. This shows why growth outside the two largest regions is becoming more important for the group.
My American fortress thesis remains an important part of the case. Evolution opened its second Michigan studio in Q2 and continues to add games. Ice Fishing is planned for North America in Q4, while the new Spinning Whale slots brand is aimed at the North American market.
This is broadly what I expected: continued investment in a market where Evolution already has a strong position. Still, the reported growth of 13.6% is below the 25% North American CAGR in my November 2025 base case. We cannot use the group’s currency adjustment to estimate the regional effect.
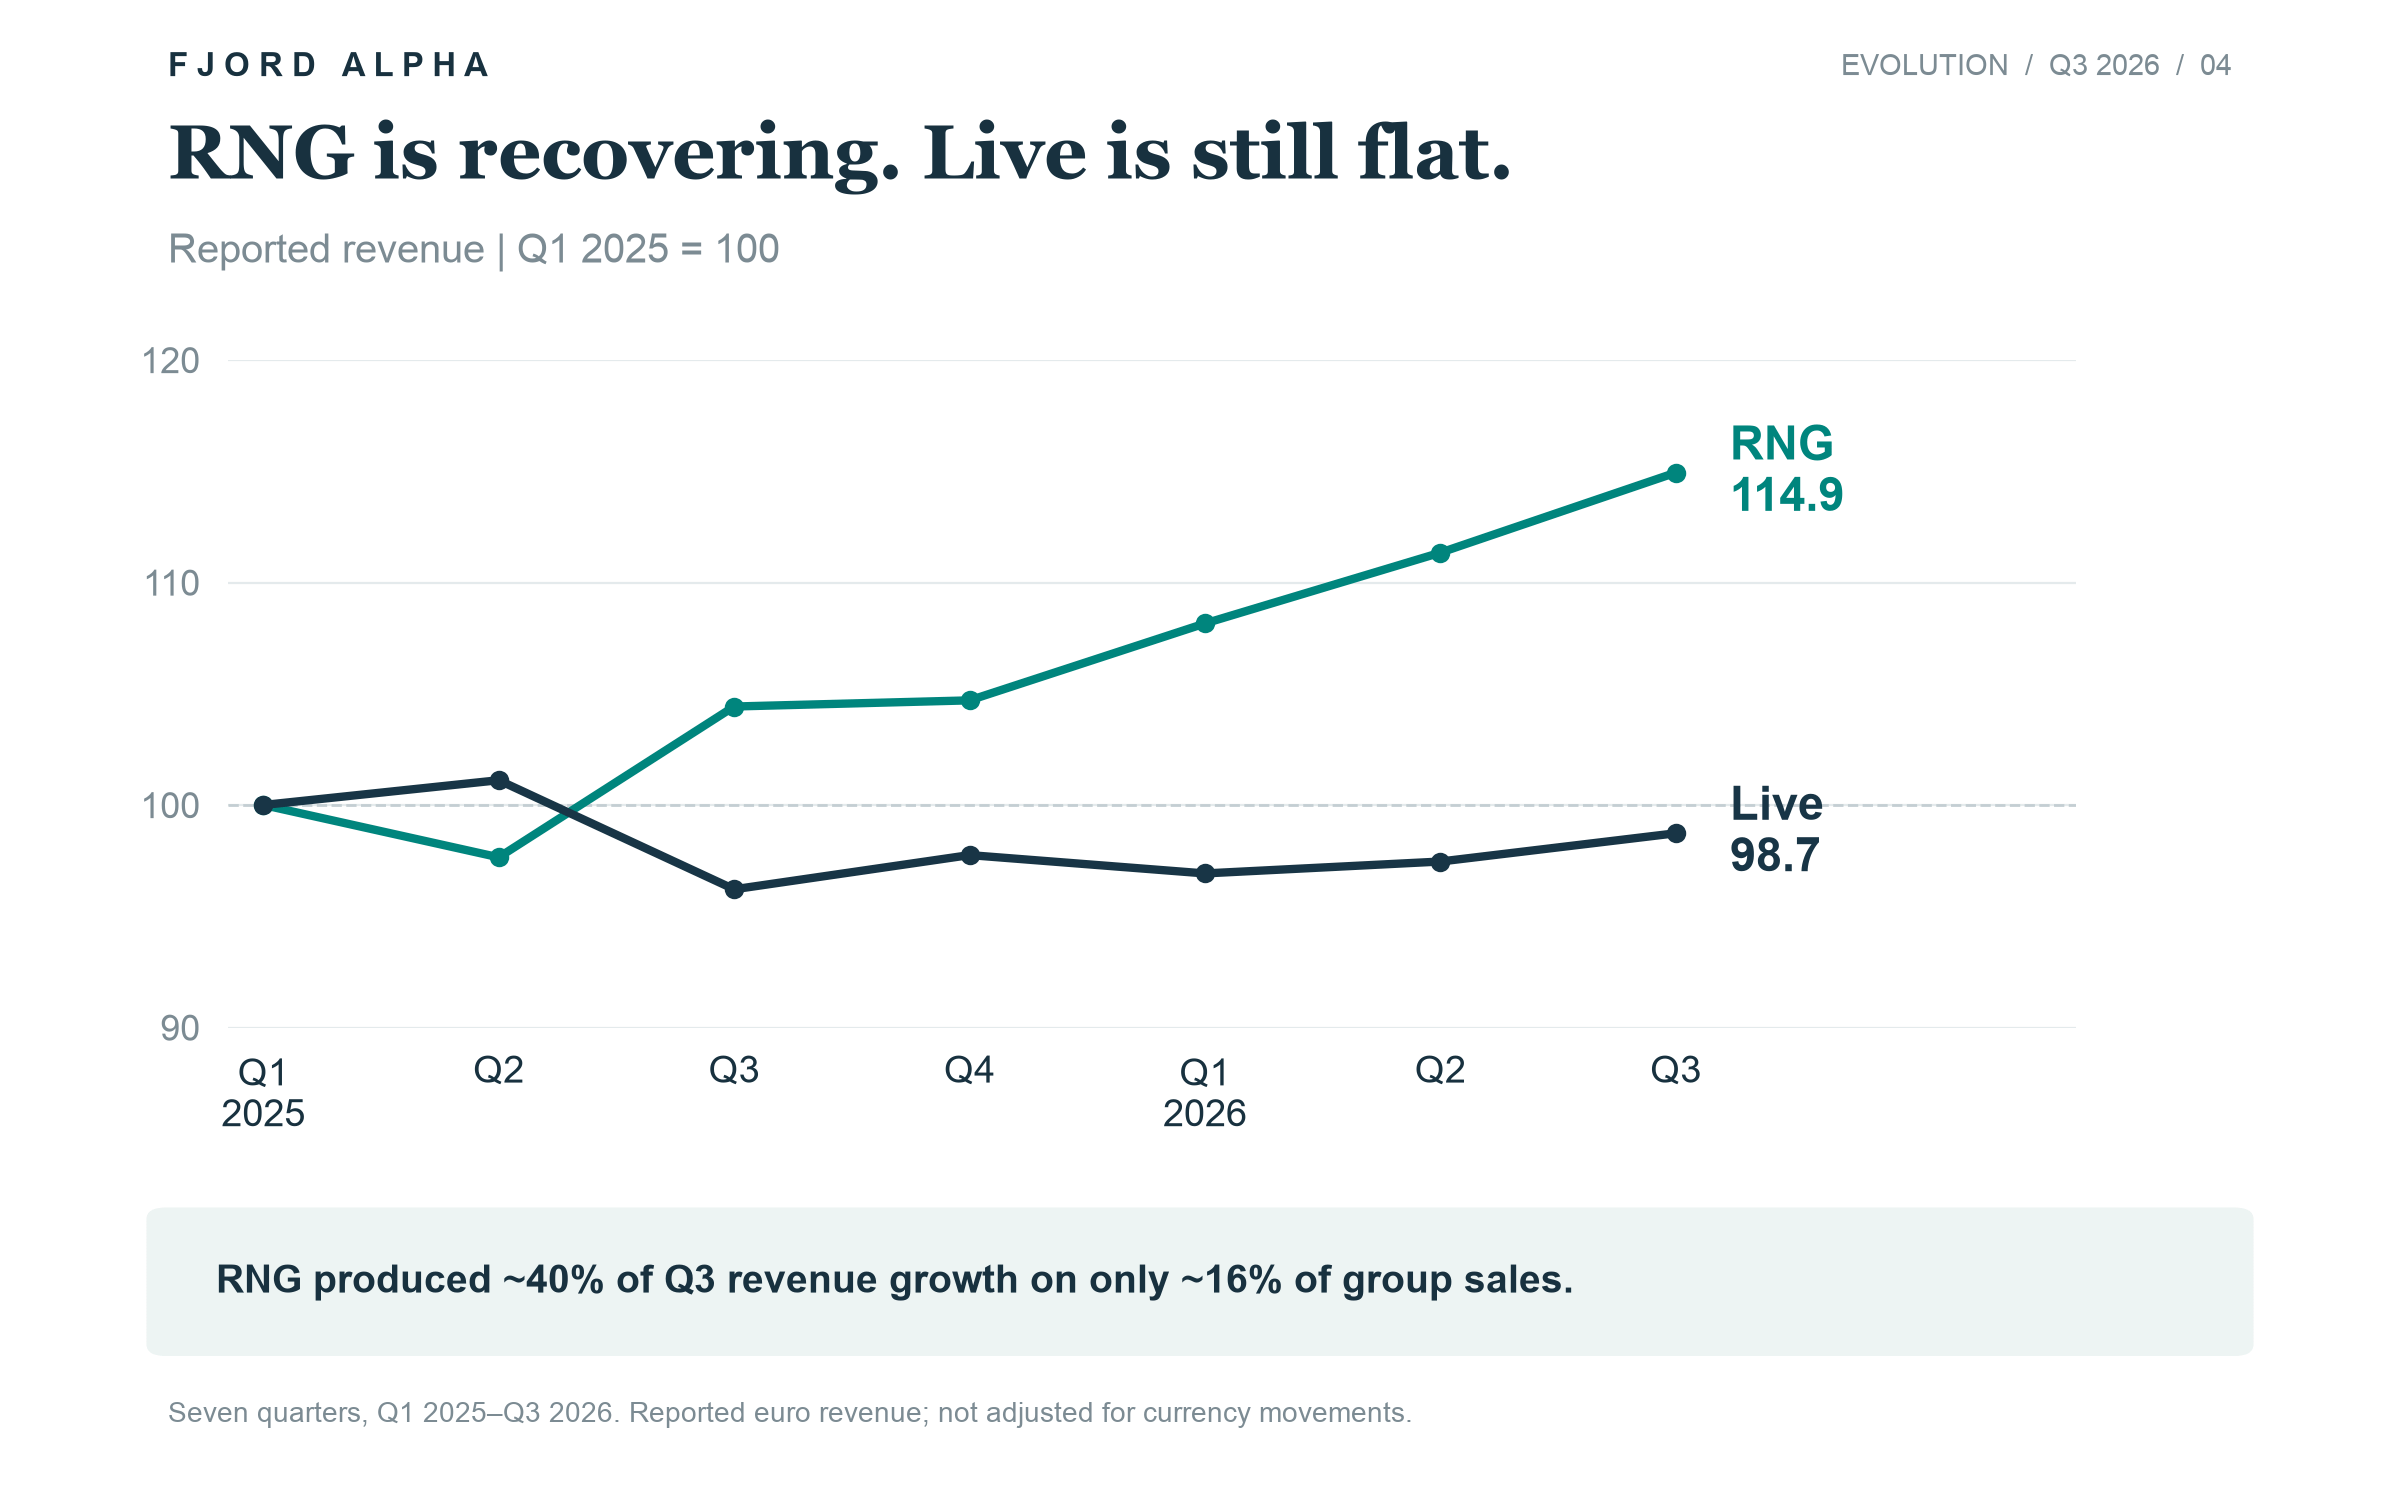
RNG is doing better than I expected. Revenue increased 10.1% to €83.1 million. It contributed roughly 40% of the group’s revenue increase, even though it represents only around 16% of sales. In my earlier model, I assumed low-single-digit growth for RNG. The current development is clearly better than that.
Live also returned to growth, increasing 2.6% to €443.0 million. Across all games, the rounds index grew 22.5%, far ahead of revenue. Faster games and smaller bets can explain part of this difference. For me, higher activity is positive, but the new games also need to produce higher revenue and earnings.
Europe and Asia are still slow
Europe and Asia together represent around 70% of revenue. Their combined sales increased by only €2.3 million compared with Q2. This is why strong growth in the smaller regions still produces quite modest growth for the group.
Europe generated €173.7 million, compared with €167.1 million in Q1. The direction is better, but the recovery slowed from 3.5% sequential growth in Q2 to just 0.4% in Q3. Europe has stopped declining for now. It is too early to count on it as a growth contributor.
Asia is also uneven. Revenue of €192.1 million was up 0.8% from Q2, but still below Q1’s €197.8 million. Work against the cybercrime problems I covered earlier continues. I see some stabilization, but no clear evidence of a stronger recovery yet.
Profitability is holding up better. Adjusted EBITDA grew 2.7% to €345.9 million, with a margin of 65.8%, almost unchanged from Q2. This supports the view that Evolution can maintain margins in the mid-60s while investing in expansion.
However, we are not seeing much margin improvement from higher revenue yet. Reported EBITDA fell 0.9% and net profit declined 3.6%. The difference between reported and adjusted EBITDA was €12.1 million, covering the UK Gambling Commission settlement and Galaxy Gaming termination and legal costs. It makes sense to separate these costs when looking at ongoing operations, but shareholders still pay for them.
Brazil is a setback
In Q1, I wrote that Brazilian regulation was paying off. Now the studio is temporarily closed following the regulatory changes in October. This is a setback for one of the markets expected to support future growth.
I have previously argued that regulation can strengthen Evolution’s position by making it harder for competitors to enter. Brazil is a reminder that regulation can also remove access to a market where the company has already invested.
Management says Brazil represents well below half of Latin American revenue by player IP. Latin America is about 9.3% of group sales, which puts the indicated Brazilian exposure well below 4.7% of the total. This helps put the risk in perspective, but we still do not know how long the closure will last or what it will cost. The revenue share is also not an estimate of how much revenue will be lost.
The UK review has at least concluded. The regulator found weaknesses in risk assessment and anti-money-laundering controls and required an independent audit. One uncertainty has been reduced, but work on compliance continues.
These events matter for valuation. Evolution’s margins are very high, but access to some markets is less predictable. I would allow for this risk in the assumptions rather than expect every setback to be temporary.
Buybacks lift earnings per share
Capital allocation is the clearest development since my Q1 article. Evolution spent €823.9 million on buybacks during Q3 alone. By the end of September, it had spent €1.127 billion under the €2 billion programme announced in May. It also cancelled 16.2 million shares during September.
The average basic share count was 7.8% lower than a year earlier. This helped basic EPS increase 4.6% to €1.31, despite the 3.6% decline in net profit.
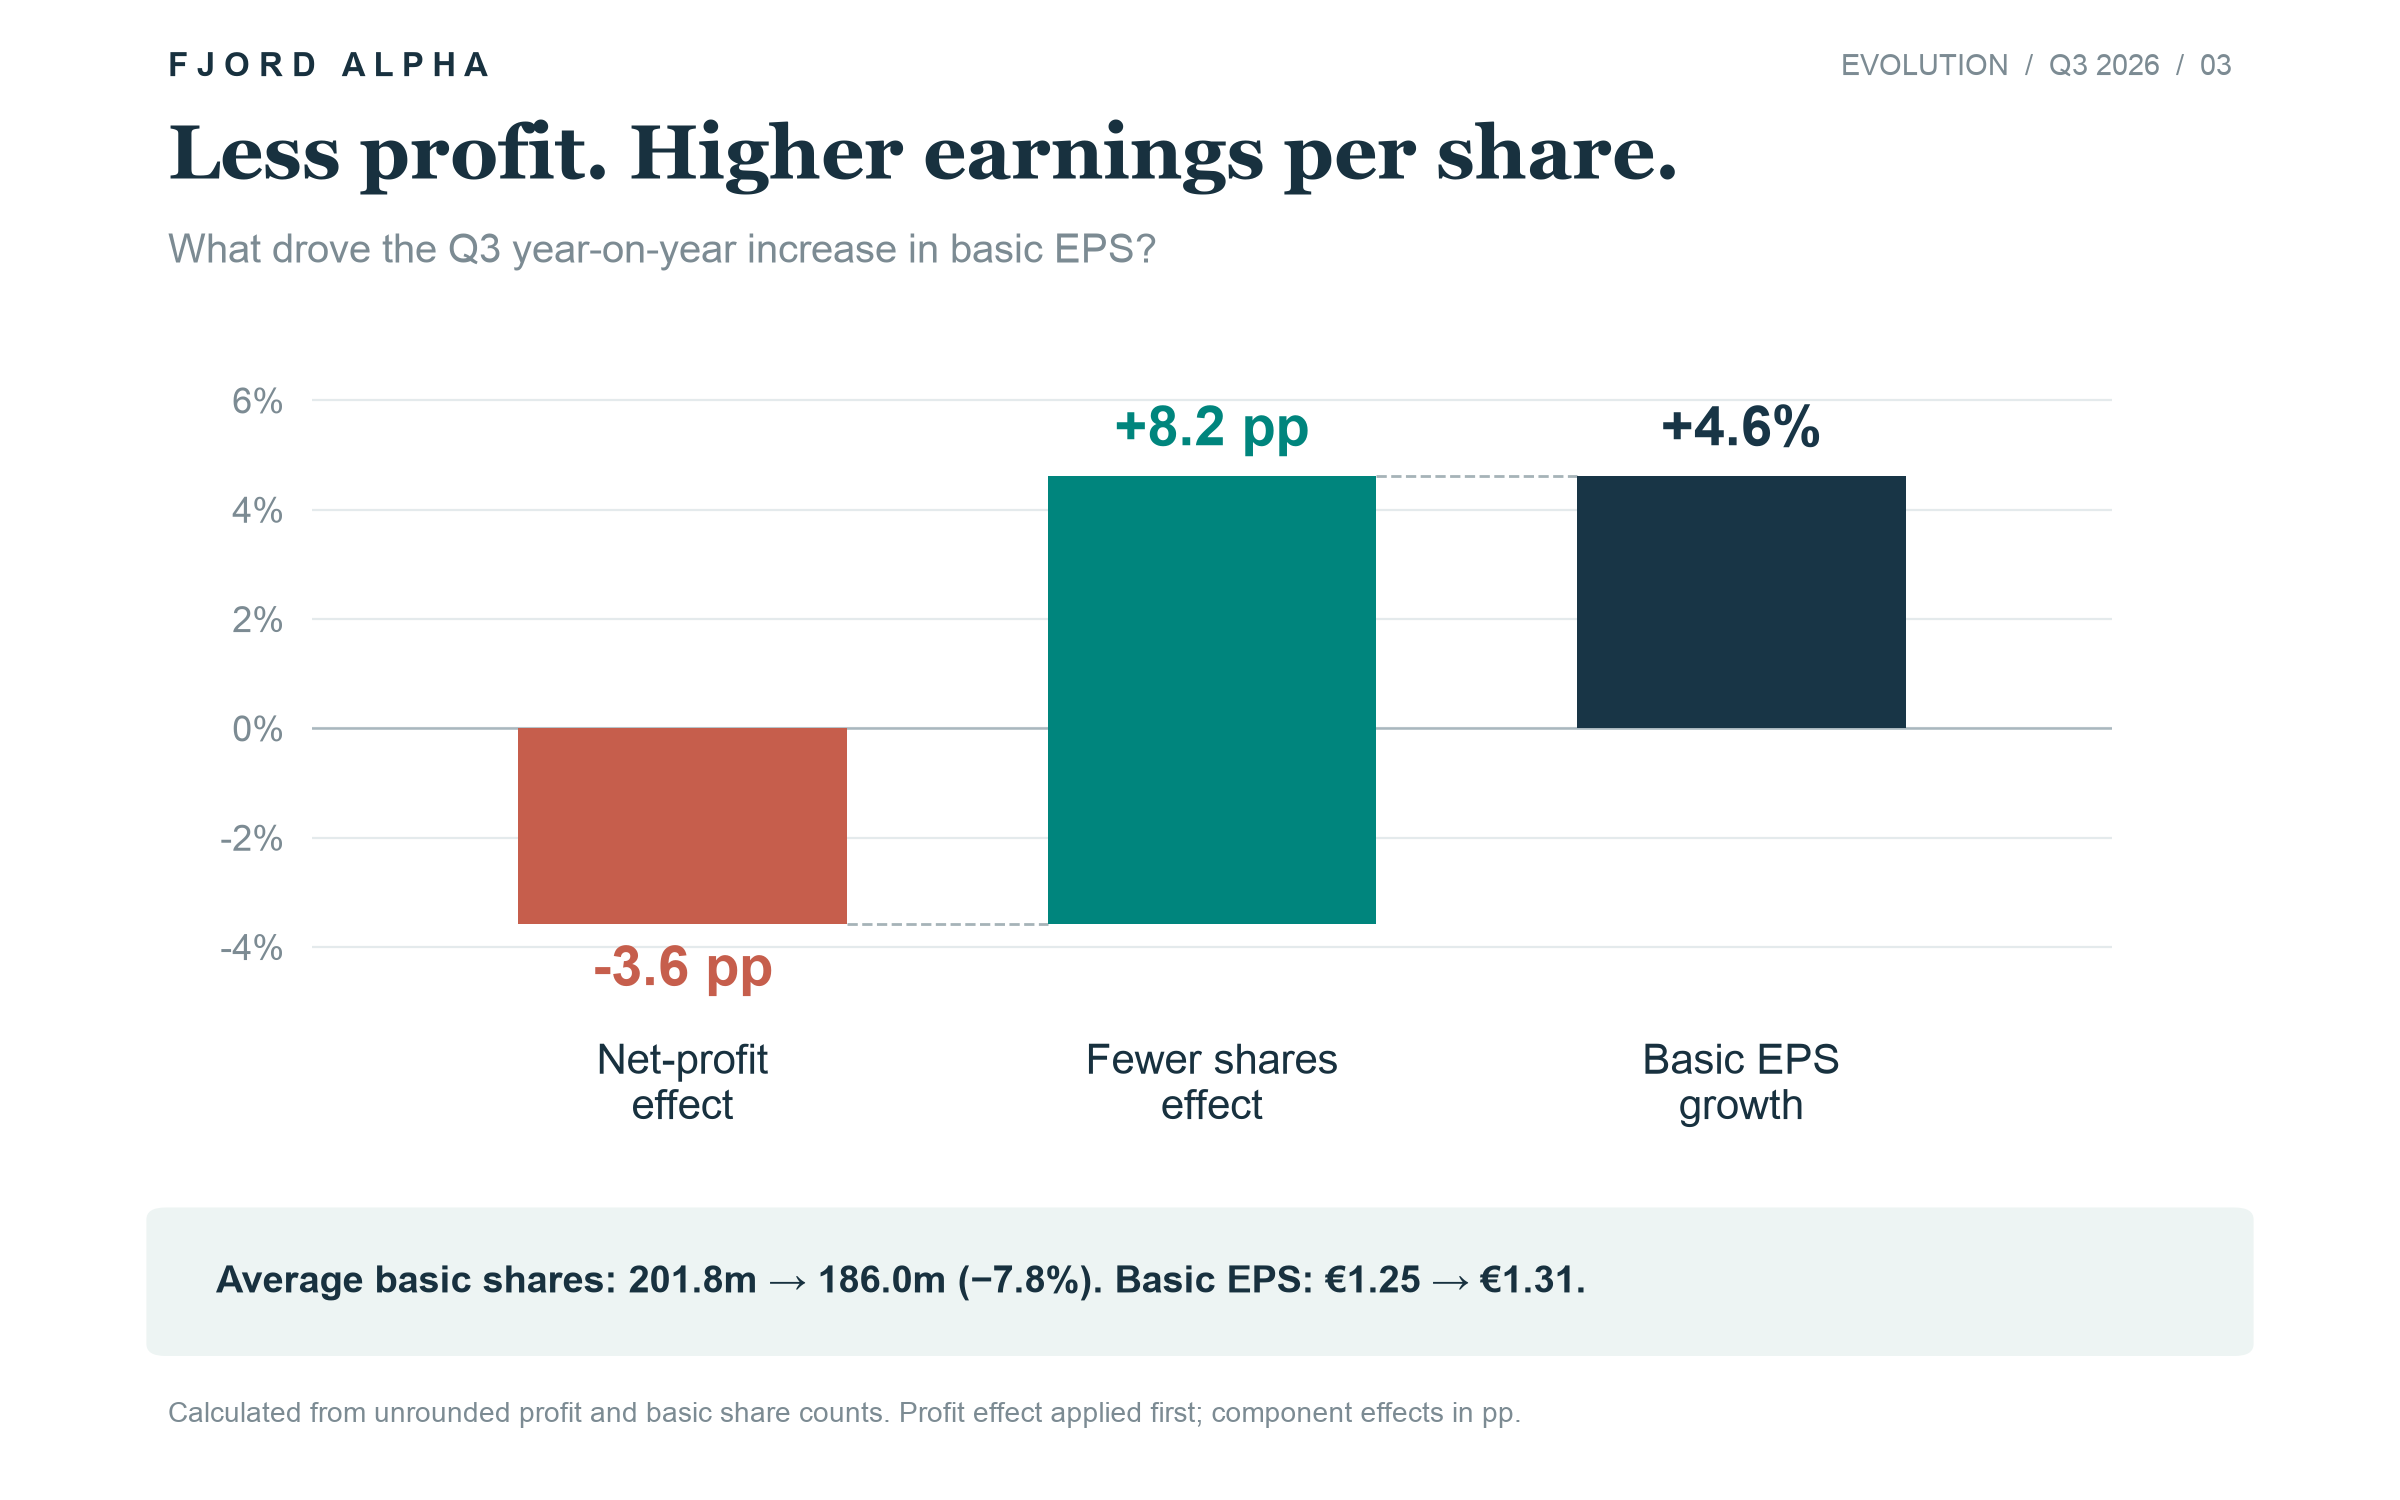
This is the effect I discussed when the dividend was suspended. Each remaining share owns a larger part of the business. That is useful while growth is weak, although I still want to see the total profit increase as well.
Candle Lake’s SEK 695 offer was a required bid after its July purchase took the holding above 30%. Candle Lake also stated that it did not intend to buy all outstanding shares. I see little reason to make this a major part of the investment case or assume a takeover premium.
Cash generation remains strong. Operating cash flow after investment in tangible and intangible assets was €334.1 million. However, working capital added €32.5 million and cash tax paid was only €0.2 million, compared with a €45.1 million tax expense. Lease principal repayments are also outside operating cash flow. I would therefore be careful about using this quarter as a normal cash flow level or assuming the same buyback pace can continue indefinitely.
Valuation update
At SEK 841.40, Evolution trades at around 14 times reported LTM earnings and 9.7 times adjusted EBITDA. That uses the September share count and balance sheet, includes lease liabilities and excludes restricted jackpot cash.
I have rolled the five-year model forward to Q3 2031 and updated the actuals and share count. The model projects revenue and earnings, applies an exit multiple and adds the cash remaining after investment and capital returns.
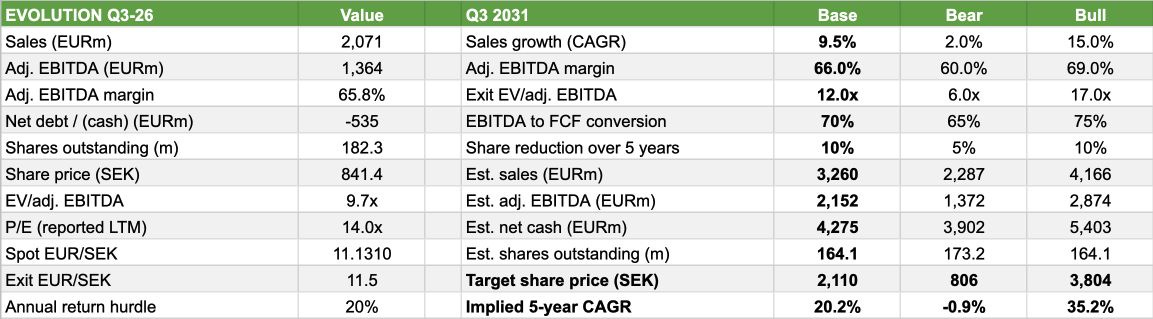
Growth is the main change from my November 2025 model. I now use 9.5% annual revenue growth in the base case, down from 11%. The Americas and RNG should contribute more as they become larger parts of the group. But Europe and Asia also need to stabilise and return to growth. With constant-currency growth of 4% today, 9.5% still assumes a meaningful recovery.
I keep the 66% adjusted EBITDA margin and 12x exit multiple. The margin is close to the current level, while the multiple assumes some improvement in how the market values the business. The old exit exchange-rate assumption of SEK 11.5 per euro is also unchanged.
For cash generation, I use a 70% conversion of adjusted EBITDA into free cash flow after tax, capex and lease payments. Using the average of opening and exit EBITDA gives about €6.2 billion over five years. I then deduct the existing net current tax liability and the cost of future buybacks. This leaves estimated net cash of about €4.3 billion at the end of the period. It is a normalised estimate, rather than an extrapolation of the unusually strong Q3 cash flow.
The model assumes a further 10% reduction in the share count over five years, to around 164 million shares. At an average repurchase price of roughly SEK 1,262, this costs about €2 billion. It assumes buybacks continue beyond the current programme. The repurchase cost is deducted from the cash added to the exit value.
The base case gives revenue of about €3.3 billion and adjusted EBITDA of €2.2 billion in Q3 2031. Applying the exit multiple, adding the remaining net cash and dividing by the lower share count gives a target of about SEK 2,110. From SEK 841.40, that is 20.2% annual price appreciation over five years.
The bear case uses 2% growth, a 60% margin and a 6x exit multiple, giving about SEK 806 and a slightly negative annual return. The bull case uses 15% growth, a 69% margin and 17x, giving about SEK 3,804 and a 35% annual return. The range is wide because the regional recovery and market access can develop very differently.
The base case only just clears my 20% hurdle. At 9% growth, the estimated return is 19.6%. The difference is small, and the model remains sensitive to growth, currencies and the exit multiple. My conviction therefore depends on the recovery continuing and cash generation supporting the buybacks.
Final thoughts
Verdict unchanged: BUY.
Q3 gives me more confidence in capital allocation and profitability. The board is using the cash for shareholders, margins remain strong, and the smaller growth markets are becoming large enough to matter. Europe and Asia are still the missing pieces.
I remain a buyer and would continue building exposure gradually. The updated model supports a return around my 20% hurdle even with lower growth than in the old case. The higher target also reflects a later end date and a lower share count. It should not be read as a stronger view of current growth.
The share price has recovered faster than group revenue. The next step needs to come from the business. Buybacks help, but I want total earnings to grow as well.
What I will follow next
For the coming quarters, I will mainly look at five things:
Europe and Asia: Both need to show more consistent sequential growth. Together they are too large for the smaller regions to carry the whole recovery.
Brazil: When can the studio reopen, and what is the effect on revenue and costs while it remains closed?
North America and RNG: Can North America increase its growth rate, and can RNG maintain its stronger performance?
Live and margins: I want new games to produce faster revenue growth and, over time, higher earnings from the existing cost base.
Cash flow and buybacks: How much cash remains after normal tax payments and investment, and how quickly is the share count falling?
The next reports need to show that the recovery is spreading to the two largest regions. If margins hold and growth improves, the current valuation leaves room for a good return. If the share count keeps falling while total earnings stand still, I will lower the growth assumptions further.