Evolution AB: Updated five-year outlook
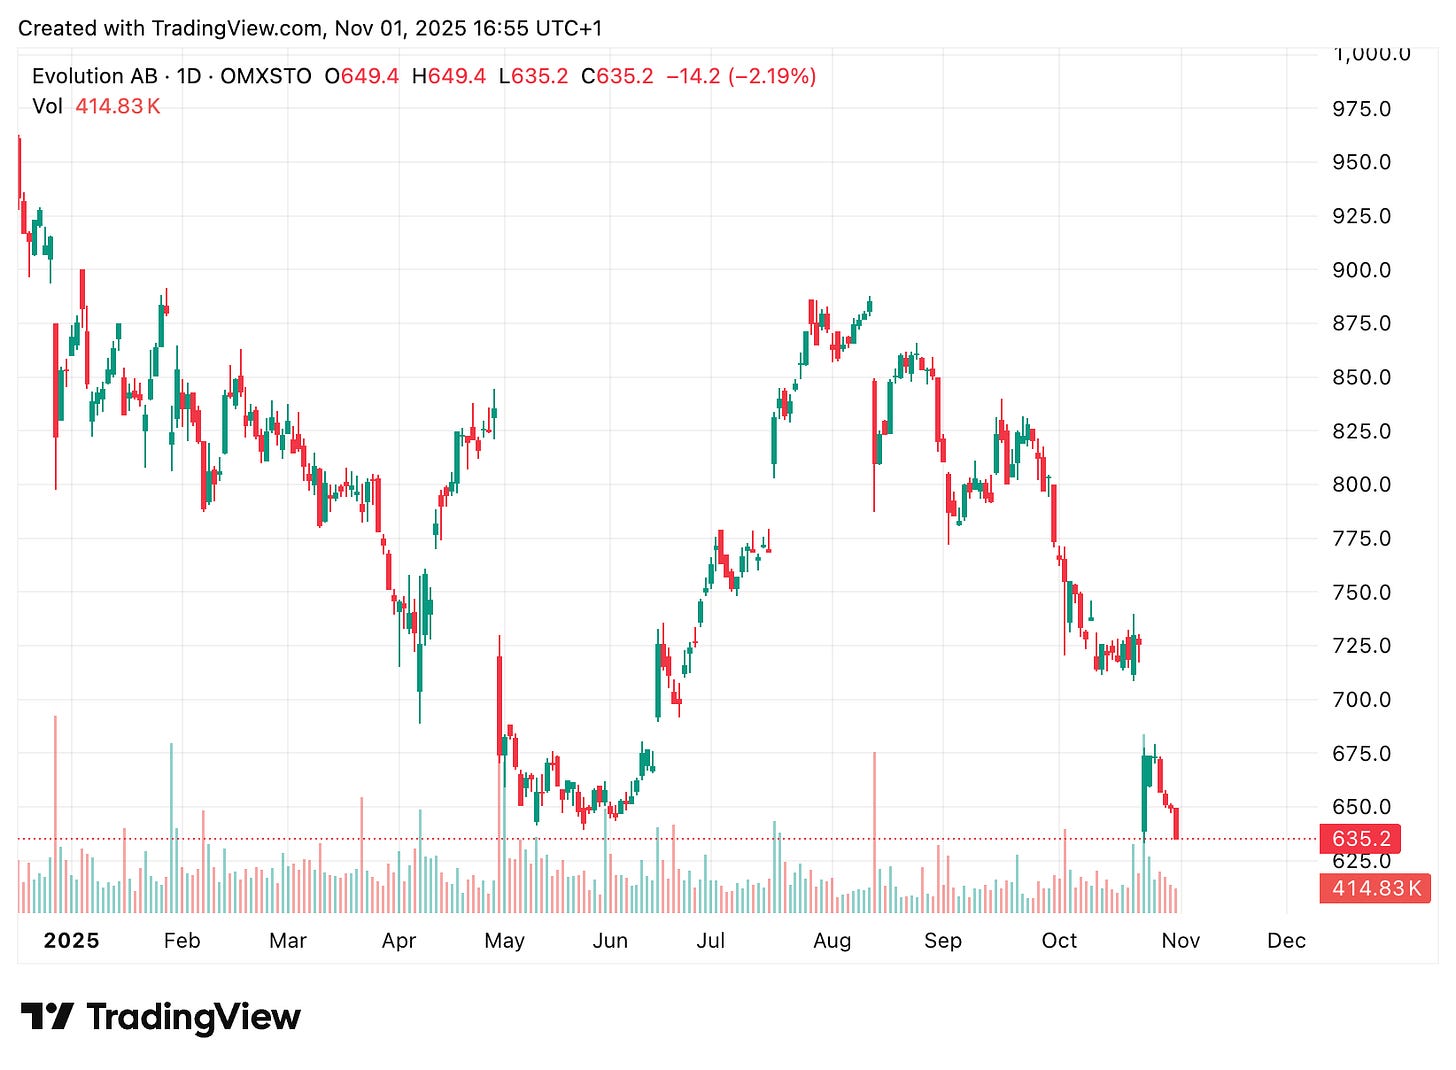
After the sharp recent sell-off and weak Q3’25 print, my refreshed five-year valuation model still supports a Buy rating.
Introduction
There’s been a lot of noise around Evolution AB this past quarter, especially after the latest earnings report. Many investors seem to be giving up on the stock and selling their holdings. I have refreshed my valuation, and I believe selling now is a mistake. We are likely at a point of maximum pain.
Yes, the report was bad, and yes, the concerns are real. And of course, it often sounds smarter to be critical / negative.
But in this case, I think the odds are stacked in our favor. The underlying trends still speak for Evolution, and the valuation has come down even further.
If you are interested, you find my separate commentary on the Q3’25 report here: Evolution Q3-25: Finding the green shoots in a disappointing report
Happy reading.
Refresh of the peer group valuation
First, let’s look at relative valuation versus relevant peers. I use the same peer group as in my original memo, divided into two tiers. Tier 1 includes Evolution’s closest operational comparables, i.e. the B2B suppliers, while Tier 2 consists of high-growth B2C operators driving the North American market.
Tier 1: B2B Suppliers: This is the core comparable group. It includes Evolution’s most direct Live Casino competitor, Playtech (PTEC.L), as well as the legacy land-based giants Light & Wonder (LNW) and Aristocrat Leisure (ALL.AX), both key competitors in the iGaming space. I also include Kambi Group (KAMBI.ST) as a pure-play B2B sportsbook supplier, providing an additional B2B-only reference point.
Tier 2: B2C Operators: This group includes the high-growth, U.S.-focused operators DraftKings (DKNG) and Flutter Entertainment (FLTR). While their customer-acquisition-driven models differ from Evolution’s, their valuations provide a useful market multiple for the fast-growing, regulated U.S. iGaming opportunity that Evolution is actively pursuing.
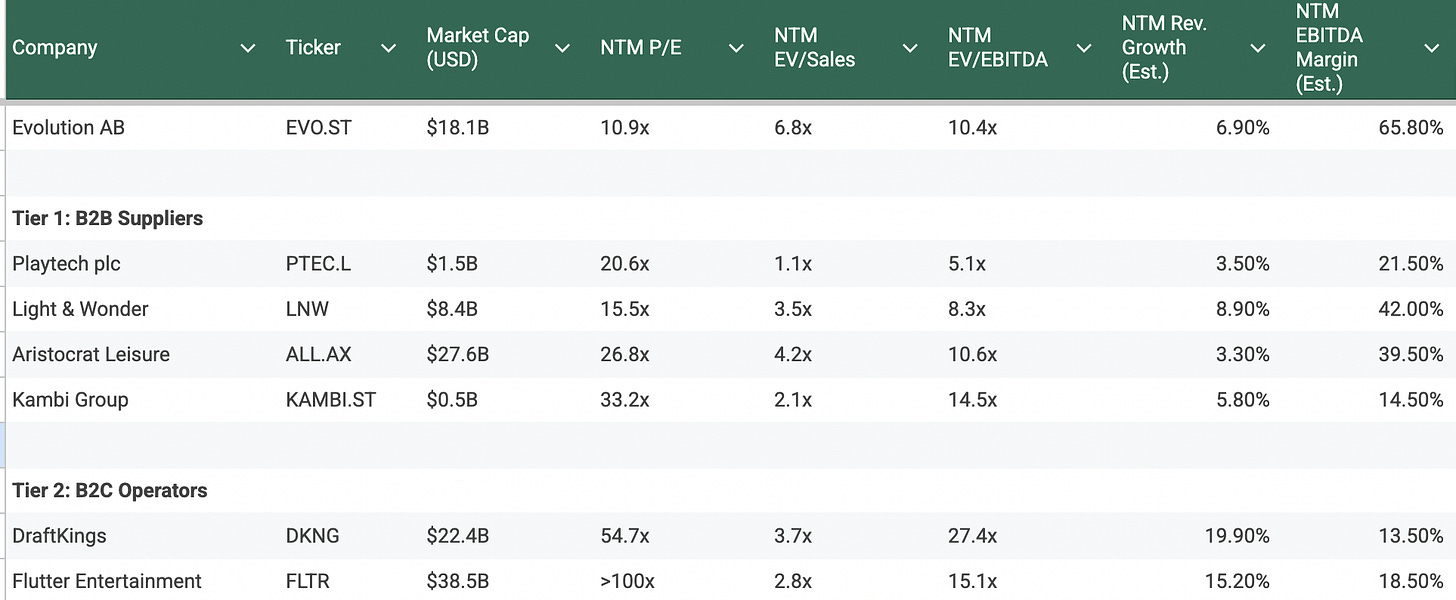
The table below summarizes the forward-looking consensus metrics for this peer group.
This table highlights a clear disconnect in valuation and profitability across the peer set. Evolution is being valued like an ordinary B2B supplier, even though its economics, market position, and growth optionality more closely resemble the leading B2C operators. I believe this disconnect is the opportunity.
B2B valuation comparison: Evolution trades at 10.4x NTM EV/EBITDA, broadly in line with the Tier 1 B2Bs (LNW at 8.3x, ALL at 10.6x).
Kambi: Despite generating only a 14.5% EBITDA margin and showing modest growth expectations, Kambi still trades at 14.5x EBITDA, with a fraction of Evolution’s profitability and scale. This likely embeds M&A/pipeline optionality. Without that, the spread to Evolution’s economics looks unjustified.
Playtech screens lower, reflecting litigation overhang and headline risk. Multiples are most likely distorted.
P/E ratio: Although not my main valuation comparison, Evolution trading significantly lower than peers
B2C benchmark: DraftKings (27.4x) and Flutter (15.1x) trade at much higher multiples on stronger revenue growth, yet their margin structures are anemic in comparison.
Refresh of valuation
My five-year valuation model rests on the thesis that Evolution’s margin profile is sustainable and its growth will successfully pivot. I am using EV/EBITDA as my primary valuation metric. I am not factoring in any effect from the Playtech lawsuit, i.e., I exclude both costs and any payout (treat it as a free option). My valuation is triangulated across three distinct narratives:
Base Case Narrative:
This scenario assumes the Asian revenue stream stabilizes after the painful 2-year period of volatility and starts a slow recover leading to a 5% revenue CAGR across the next five years. The Q3 2025 “over-extended countermeasures” are balanced, and the cybercrime issues prove to be technical, not existential.
Crucially, this Asian volatility is more than offset by high-octane growth from North America and Latin America. See my special analysis of the US market, where I forecast a 5y CAGR of 25%, as Evolution’s live casino monopoly captures the lion’s share of new markets.
Europe, which started seeing a small uptick in revenue QoQ in the Q3-report, starts to pick up speed, and I pencil a 7% revenue CAGR. For the emerging “Other” segment I assume a strong 20% growth, although it has limited overall impact on the absolute number.
The RNG segment remains a low-single-digit grower, a drag on the consolidated number, but still growth additive across the geographies.
Margins, which have already compressed to 66.4% as of the Q3 2025 report, stabilize near this new level. Higher compliance costs in regulated markets prevent a return to the 68-70% highs, and I model a long-term stable margin at the low end of management’s current 66-68% guided range: 66.0%.
Share counts decrease by 5% via continued buy-backs.
Valuation multiples expand slightly due to improved economics.
Bull Case Narrative:
This scenario models a full re-acceleration and a 17% revenue CAGR.
The Asian market rebounds as management successfully balances security and revenue. Asian growth returns to double-digits.
Simultaneously, North American and LatAm growth is explosive as new game shows and the multi-brand strategy (Ezugi) create a new, larger-than-expected market.
The RNG segment turnaround, a long-stated management goal, finally succeeds and grows at high-single-digits.
Scale benefits in new studios drive margin expansion from current levels, and EBITDA margins expand past the high end of the current 66-68% guided range to 69.0%, approaching the highs of previous years.
Share counts decrease by 5% via continued buy-backs.
Valuation multiples expand significantly due to improved economics.
Bear Case Narrative:
This scenario models a permanent impairment, and a minimal 5% annual growth rate for the coming five years.
The Asian revenue never recovers and declines slightly for five years. The cybercrime and piracy issues are proven to be structural.
Simultaneously, the allegations from the 2021 Playtech-commissioned report are independently verified and gain traction. Regulators use this to delay or block licenses, crippling its regulated growth pivot in the Americas. Evolution’s lawsuit against Playtech fails or backfires. Competitors use this opportunity to steal market share.
High compliance costs and pricing pressure lead to significant margin compression from today’s 66.4% level, falling well below guidance to 60.0%.
Share counts remains stable.
Valuation multiples collapses due to worsened economics.
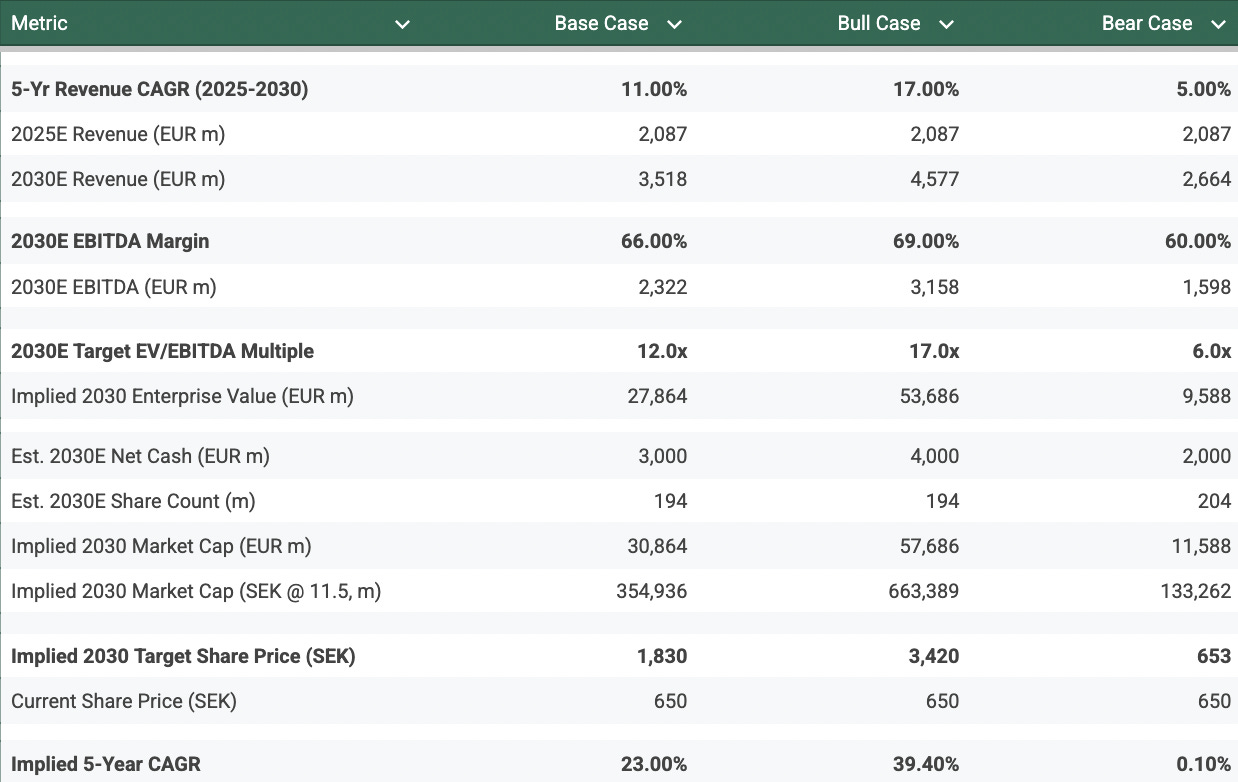
The table below details my five-year valuation model, based on a starting price of SEK 650 and 204.0 million shares outstanding.
Conclusion on valuation - still a “BUY”
The analysis shows a high variety in the set of outcomes, which is perhaps not surprising for an investment facing clear risks (e.g., regulation) and high, structural upside (market monopoly, secular trends). The valuation is dependent on which narrative an investor subscribes to.
My Base Case, which I believe is the most probable outcome, rests on management’s ability to navigate this difficult but manageable transition. It assumes the lower end of the margin guidance is credible and that growth in especially North America will be sufficient to offset slower Asian growth, and deliver a durable 11% top-line CAGR over the next five years. This helps support a small valuation multiple expansion.
The Bear Case, which implies a 5-year CAGR of 0.1%, suggests the stock is dead money. This scenario assumes the Asian revenue base is permanently impaired and that increased regulation neutralizes most future regulated growth, and in addition lowers profitability further. Valuation multiples contract further.
The Bull Case presents a compelling argument for a 39% CAGR, driven by high growth in the Americas and a re-rating to an EBITDA-multiple (17.0x) that properly reflects Evolution’s market leadership and margin supremacy.
My Base Case fair value estimate for Evolution AB at year-end 2030 is SEK 1,830 per share. Based on the current price of SEK 650, this target implies a 5-Year CAGR of 23.0%.
This meets the Fjord Alpha target of 20%+ annual returns. The market’s current fixation on the growth miss and the Asian headwinds has, in my assessment, created a valuation disconnect.
The current valuation bakes in the Bear Case almost entirely, offering an attractive risk/reward profile for the long-term investor, where the odds seem stacked in our favour. Time to place your bets.


My largest position to start 2026. Good luck!